Miscellaneous Data Visualizations

Below are some graphs of topics that have lately caught my attention. Currently, I am very intrigued on learning how behaviors have shifted during the COVID-19 pandemic and which of those will result in more permanent changes.
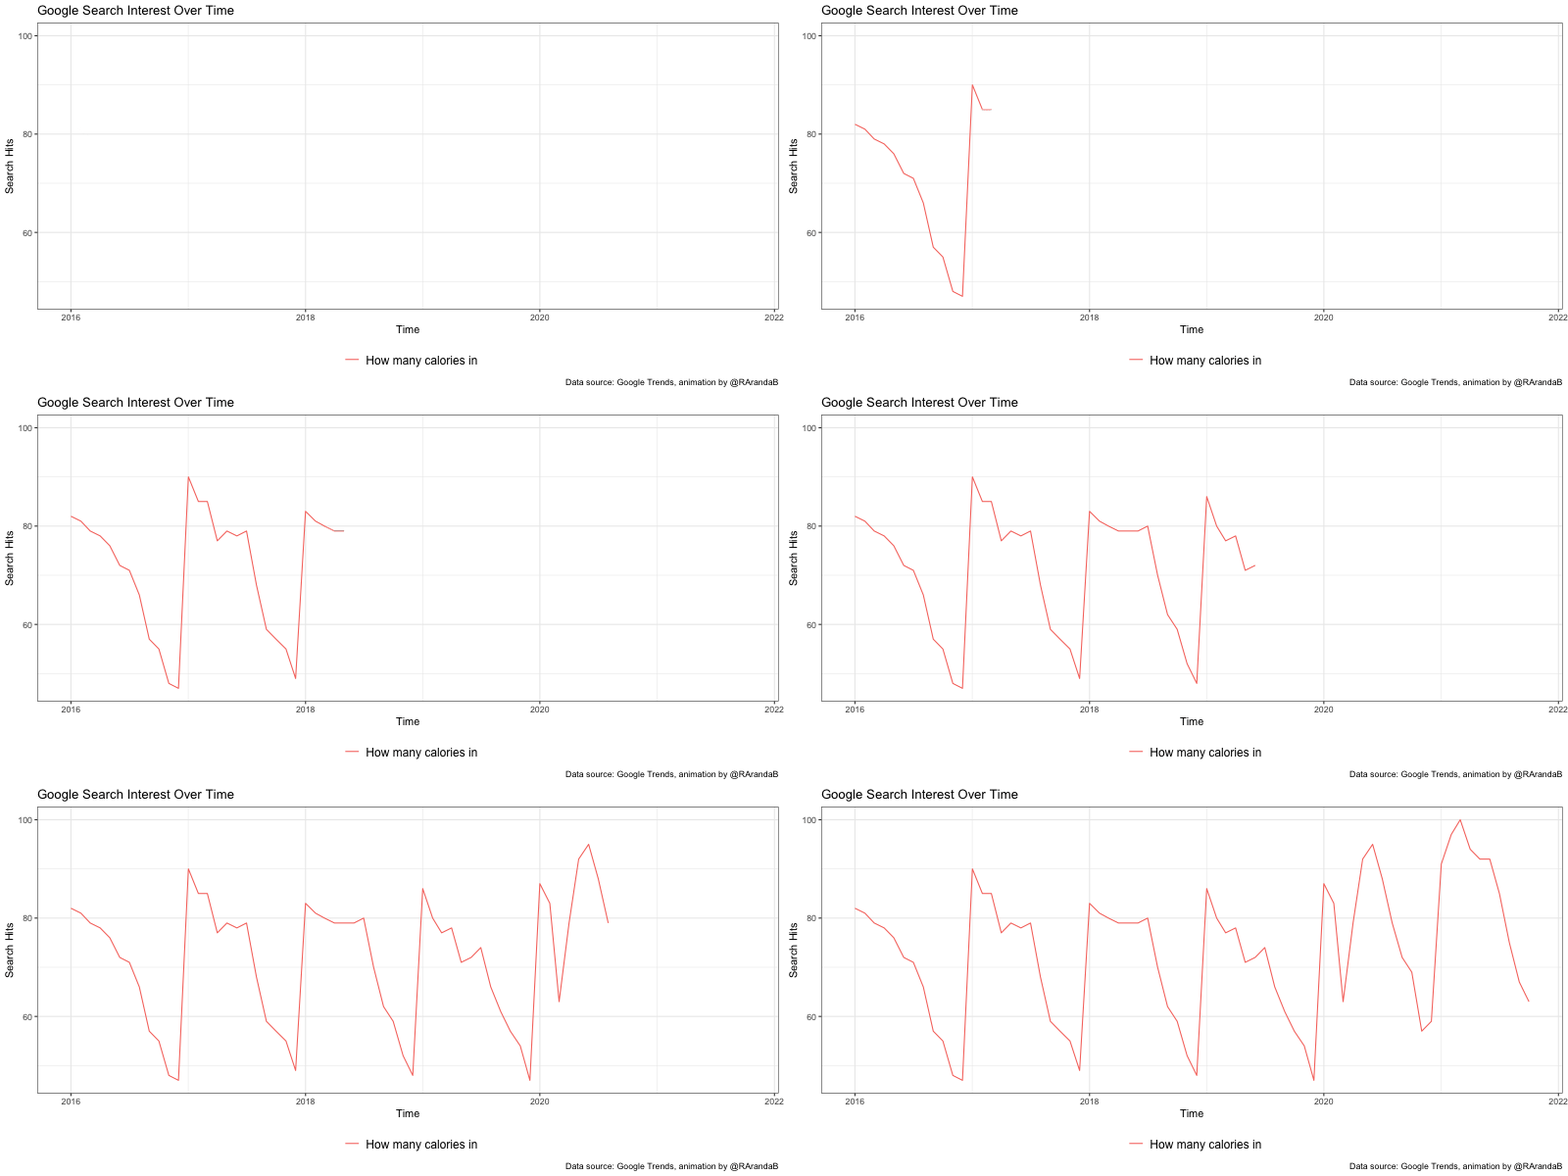
Google search interest for the number of calories in foods.
This is one of my favorite Google Trends graphs. It is very interesting to see the seasonality in searches (“New Year’s effect”) and in the current context, the change in search behaviors during the pandemic.

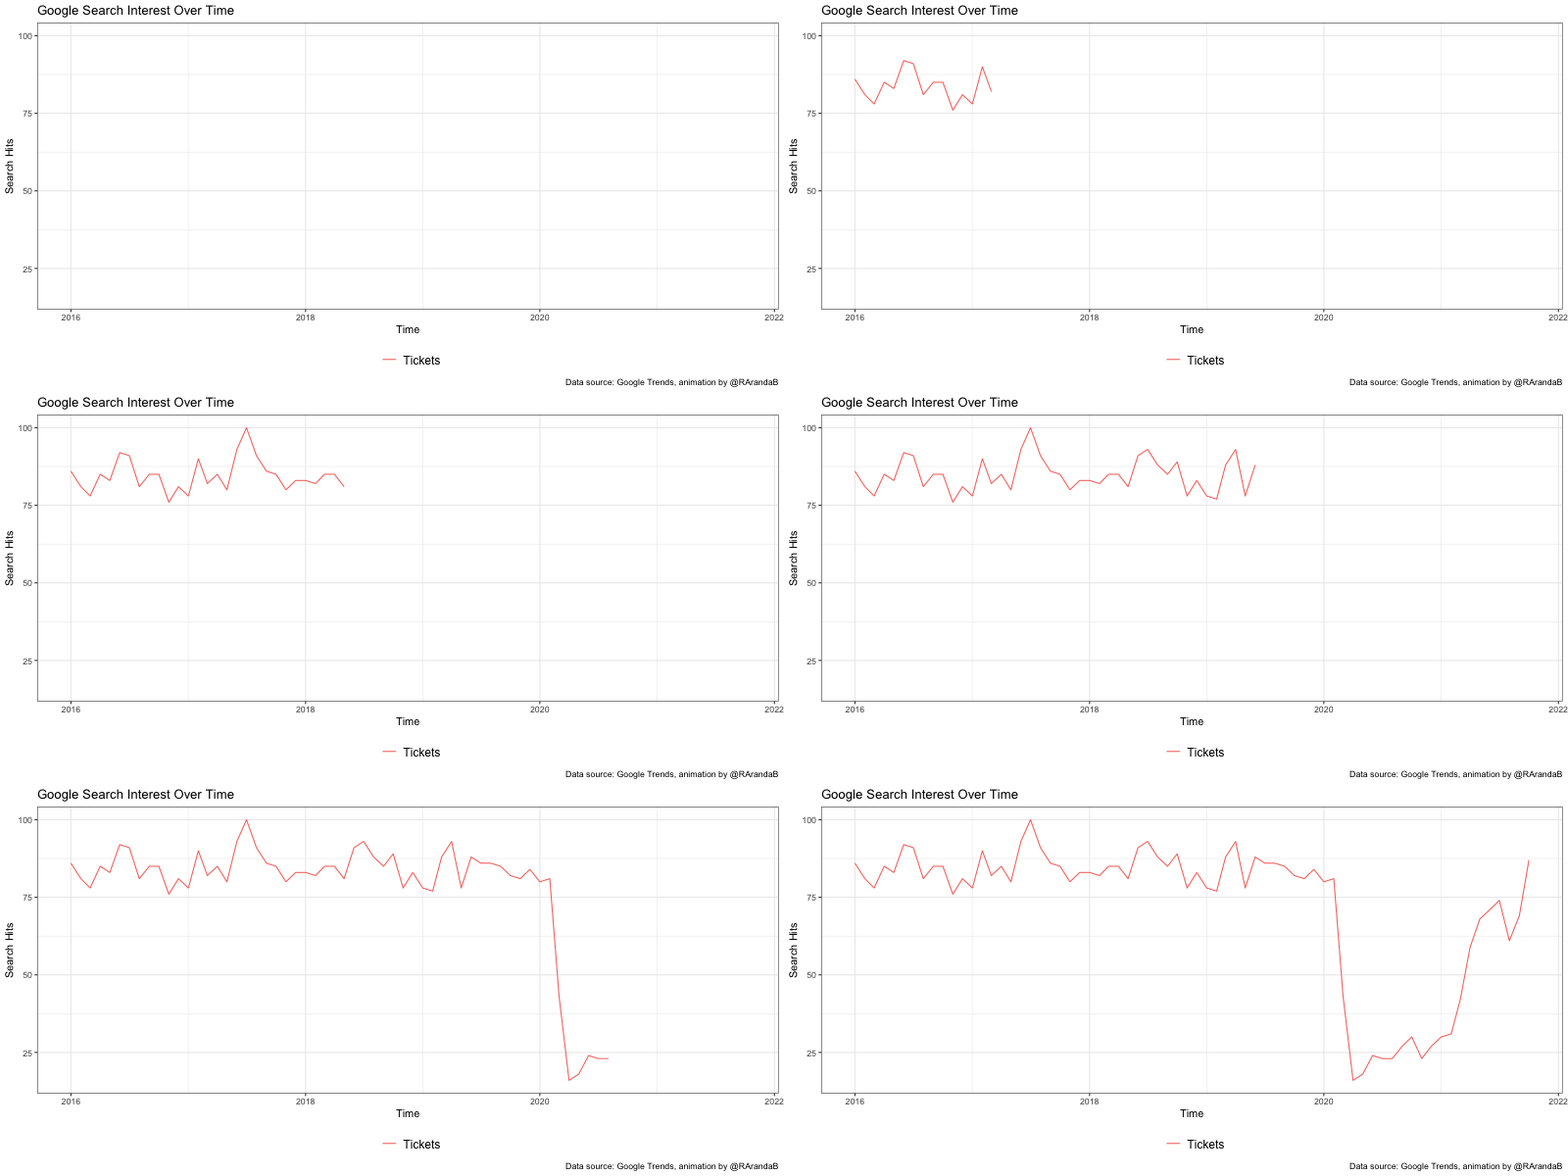
Google search interest for tickets.
This figure shows how drastic changes have been in the past few months - there is no more need for tickets for anything anymore - and highlights the struggle some industries had at the peak of the pandemic.

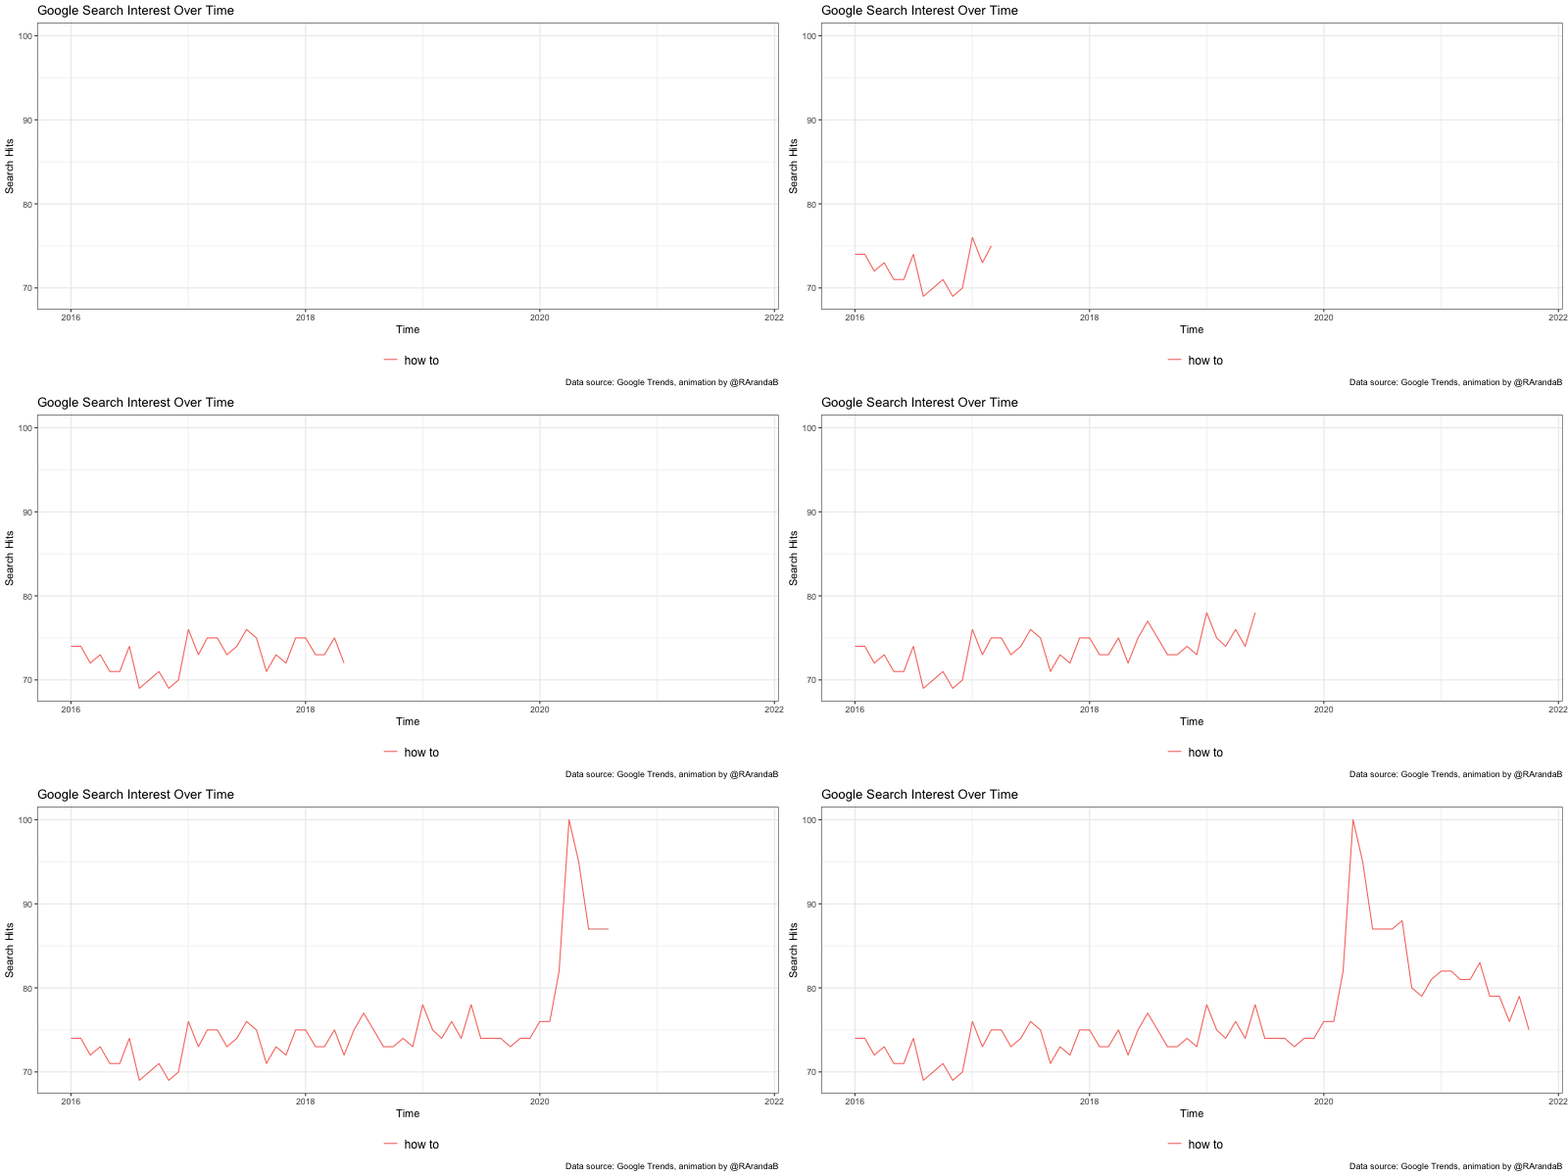
Google search interest for “How to …”
Looks like people are disproportionately going to Google to learn how to do new things… (See how to build, how to cook, etc.)

Google searches for unemployment insurance and food stamps.
<
Site built using R-Markdown. Last updated October 5, 2021, Rodrigo Aranda
arandar@usc.edu